Epileptogenicity map computation with Brainstorm
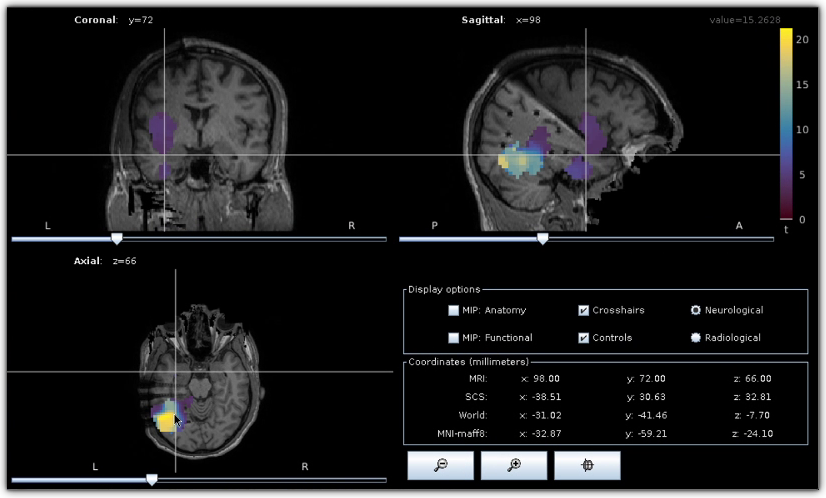
Epileptogenicity map. Epileptogenicity map computed and visualized using Brainstorm .
Disclaimer
The methods and software used in this tutorial have not been certified for clinical practice and should be considered for research purposes only.
About this tutorial
The objective of this tutorial is to guide HIP users in computing maps of epileptogenicity from ictal iEEG recordings. Epileptogenicity maps show the spatial distribution, and eventually the temporal evolution, of the Epileptogenicity Index (EI) in the subject’s brain. The EI is based on both spectral and temporal properties of iEEG signals and quantifies the presence of high-frequency oscillations also referred to rapid discharges. Rapid discharges have long been recognized as a characteristic electrophysiological pattern of the epileptogenic zone and can help identify brain regions generating seizures ([Bartolomei_2008]). This tutorial primarily consists of a video demonstration and should be viewed as an introductory tutorial because it does not go into all the intricacies of the computation of epileptogenicity maps.
For more in-depth information regarding the computation of epileptogenicity maps using Brainstorm, please refer to the official tutorial:
Requirements
There are no technical requirements to follow this tutorial because the dataset and software are available on the HIP.
HIP software used in this tutorial:
Brainstorm (07-Jan-2022)
HIP dataset used in this tutorial:
Epimap tutorial dataset (rev1.0)
Prepare the working environment
This tutorial relies on data available in the Epimap tutorial dataset, and the following files will be used:
anat/MRI/3DT1pre_deface.nii
anat/MRI/3DT1post_deface.nii
anat/implantation/elec_pos_patient.txt
seeg/SZ1.TRC
seeg/SZ2.TRC
seeg/SZ3.TRC
Copy those files into your private space so that they can be processed. Please, refer to the How to use the HIP spaces guide if you need help with this step. It is also advised to initiate a new Deskop. Please, refer to the How to use Desktops and run applications from the App Catalog guide if you need help with this step.
Compute a map of epileptogenicity
Important
Applications running in a Desktop environment have access to your Private Space data under the /home/<HIP_USER>/nextcloud directory. Any data and/or configuration file outside of this directory will be lost when the application or desktop are closed. This is the only persistent directory as it is tied to the HIP user’s Private Space at application startup. Make sure you are always working within the /home/<HIP_USER>/nextcloud directory when using applications.
It is mandatory to have the 3D positions of the recording contacts of the SEEG electrodes to compute epileptogenicity maps. The contact names and coordinates of the SEEG electrodes are provided in the elec_pos_patient.txt implantation file that will be used in this tutorial. If you work on your own imaging data and wish to generate a dedicated implantation file, you may want to look at the SEEG electrode placement with Brainstorm tutorial.
References
Bartolomei F, Chauvel P, Wendling F. Epileptogenicity of brain structures in human temporal lobe epilepsy: a quantified study from intracerebral EEG. Brain., 2008, 131(Pt 7):1818-30.